
A History of NGOs in Britain
Score of Green parties at elections in Europe (1970-2009)
Figure 1: Score of Green parties at national and European elections (Germany)
Figure 2: Score of Green parties at national and European elections (UK)
Figure 3: Score of Green parties at national and European elections (France)
Figure 4: Score of Green parties at national and European elections (Italy)
Figure 5: Proportion of Green MEPS at the European Parliament amongst the total number of MEPs
Figure 6: Number of MEPs elected on a green ticket in Europe, by country.
Figure 7: Electoral performance of selected European Green Parties
Table 1: Green MEPs elected at the European Parliament
| Back to Page Top |
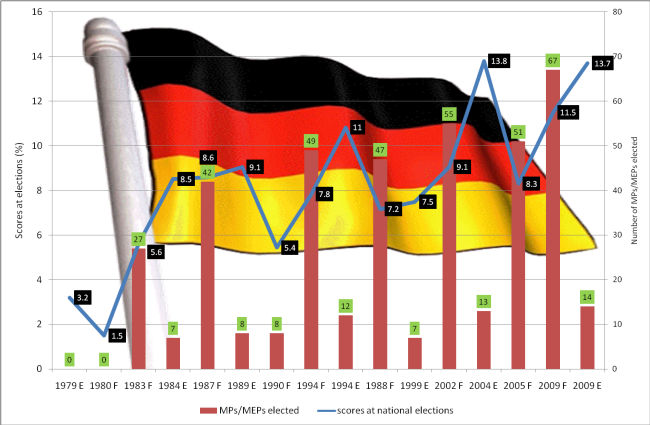
Figure 1: Score of Green parties at national and European elections (Germany)
| Back to Page Top |
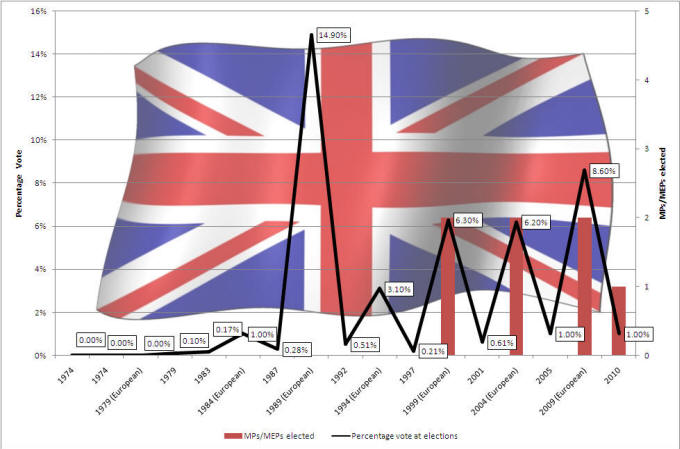
Figure 2: Score of Green parties at national and European elections (UK)
| Back to Page Top |
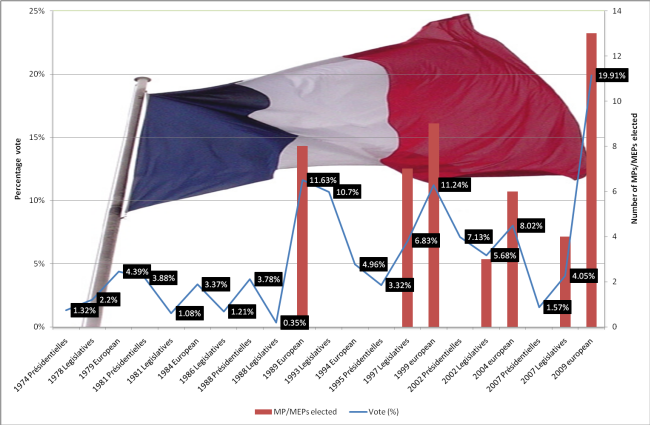
Figure 3: Score of Green parties at national and European elections (France)
| Back to Page Top |
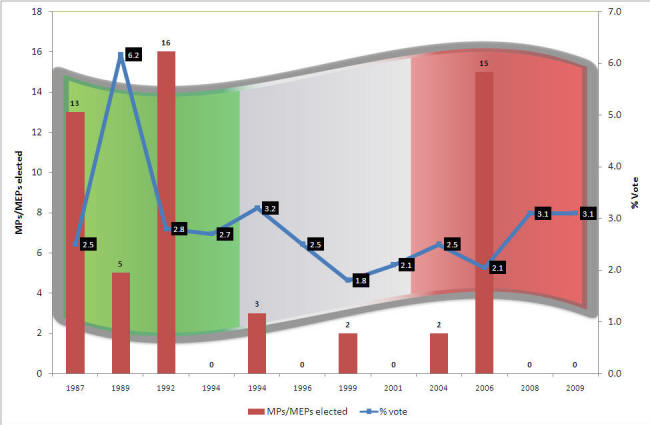
Figure 4: Score of Green parties at national and European elections (Italy)
| Back to Page Top |
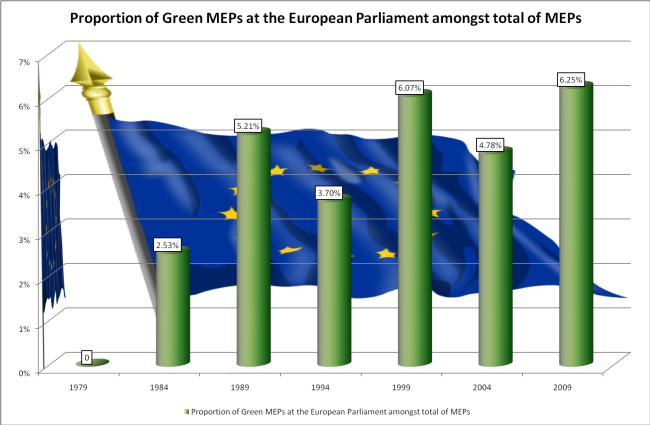
Figure 5: Proportion of Green MEPS at the European Parliament amongst the total number of MEPs
| Back to Page Top |
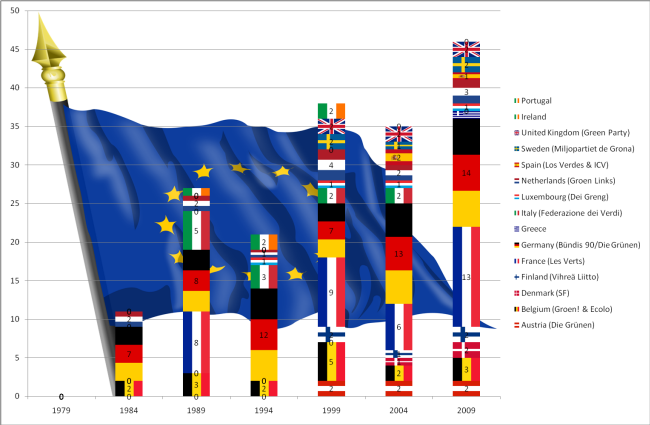
Figure 6: Number of MEPs elected on a green ticket in Europe, by country.
| Back to Page Top |
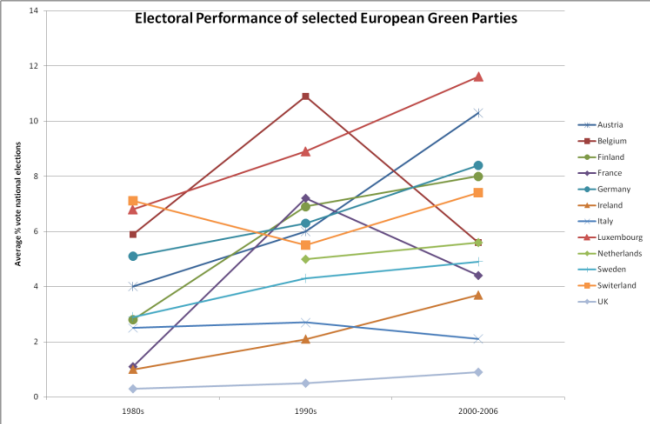
Figure 7: Electoral performance of selected European Green Parties
| Back to Page Top |
|
Green MEPs in the European elections, 2004 |
|||||||
|
MEPs elected |
|||||||
|
1979 |
1984 |
1989 |
1994 |
1999 |
2004 |
2009 |
|
|
Austria (Die Grünen) |
0 |
0 |
0 |
0 |
2 |
2 |
2 |
|
Belgium (Groen! & Ecolo) |
0 |
2 |
3 |
2 |
5 |
2 |
3 |
|
Denmark (SF) |
0 |
0 |
0 |
0 |
0 |
1 |
2 |
|
Finland (Vihreä Liitto) |
0 |
0 |
0 |
0 |
2 |
1 |
2 |
|
France (Les Verts) |
0 |
0 |
8 |
0 |
9 |
6 |
13 |
|
Germany (Bündis 90/Die Grünen) |
0 |
7 |
8 |
12 |
7 |
13 |
14 |
|
Greece |
0 |
0 |
0 |
0 |
0 |
0 |
1 |
|
Italy (Federazione dei Verdi) |
0 |
0 |
5 |
3 |
2 |
2 |
0 |
|
Luxembourg (Dei Greng) |
0 |
0 |
0 |
1 |
1 |
1 |
1 |
|
Netherlands (Groen Links) |
0 |
2 |
2 |
1 |
4 |
2 |
3 |
|
Spain (Los Verdes & ICV) |
0 |
0 |
0 |
0 |
0 |
2 |
1 |
|
Sweden (Miljopartiet de Grona) |
0 |
0 |
0 |
0 |
2 |
1 |
2 |
|
United Kingdom (Green Party) |
0 |
0 |
0 |
0 |
2 |
2 |
2 |
|
Ireland |
0 |
0 |
0 |
2 |
2 |
0 |
0 |
|
Portugal |
0 |
0 |
1 |
0 |
0 |
0 |
0 |
|
Total |
0 |
11 |
27 |
21 |
38 |
35 |
46 |
Table 1: Green MEPs elected at the European Parliament
The above table shows the number of MEPs elected specifically on a Green ticket, sometimes as part of a coalition with other parties, but when they openly displayed their green ideas. The numbers shown in "total" differ then from total number of Green MEPs in the Party groups at the European Parliament (e.g. EFA/Greens)
Note: Sources for these tables are various and too numerous to detail here.
![]()
| Back to Home | Back to Page Top |