
A History of NGOs in Britain
Membership of Environmental Groups (UK and World):
- Percentage of respondents who say they are members of an environmental organisation (source: British Household Panel Survey, 1991-2007)
- Percentage of respondents who say they are a member (active or inactive) of an environmental organisation
- Are you currently a member of any of these (Local conservation or environmental group) (1994-2005, BSAS).
- Percentage of respondents belonging to an Environmental Organisation (2000) - source: British Social Attitudes survey.
- % of the British population claiming to belong to the National Trust, the RSPB, a Wildlife or countryside group 1985-2000
- % of the British population claiming to belong to different environmental organisations 1990-2000
- Members, participants, donors and volunteers for the environment and conservation, 2000-2001
- Combined membership of 17 US environmental organisations (in '000) (1951-2004).
- Membership of 17 US environmental
organisations (in '000) (1951-2004).
- Environmental group membership over time in various countries
UK:
(compare with the figures below from the World Values Surveys):
| Back to Page Top |
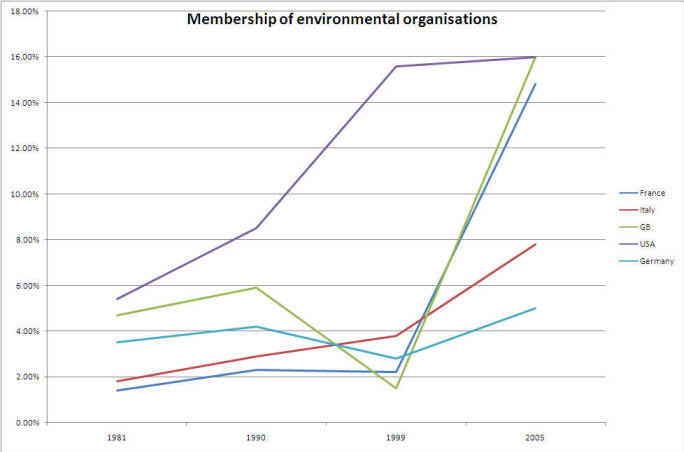
Figure 2: Percentage of respondents who say they are a member of an environmental organisation
Note: In 2006 the question was phrased: "are you a member
(active or inactive) of an environmental organisation?"; in 1999: "do you belong
to Conservation, environment or animal rights groups?"; in 1990: "do you belong
to Conservation/environment groups ?"; in 1981: "do you belong to Conservation,
environment, animal rights groups ?"
Because the questions are not consistent during the period, and sometimes
include animal rights group and sometimes not, comparisons across time are
difficult;
Source: World Values Survey, 1981-2006
| Back to Page Top |
Figure 3: Are you currently a member of any of these? (Local conservation or
environmental group) (1994-2005, BSAS).
Note that the question was broadened in 2003 and 2005, to Are you currently a
member of, or do you regularly join in the activities of, any of the
organisations on this card? (An environmental or conservation group), so this
may well account for the increase in postive responses to the question.
Source: British Social Attitudes Survey (1994-2005)
| Back to Page Top |
| Back to Page Top |
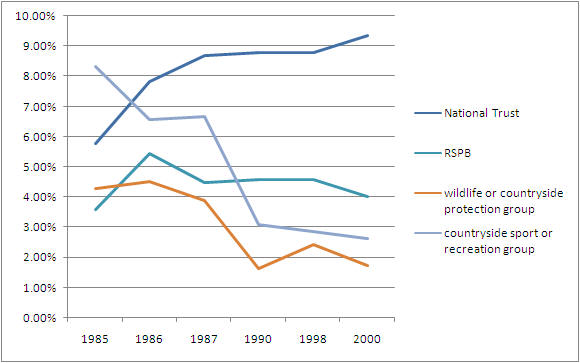
Figure 5: % of the British population claiming to belong to the National Trust, the RSPB, a Wildlife or countryside group 1985-2000 (source: British Social Attitudes Survey)
| Back to Page Top |
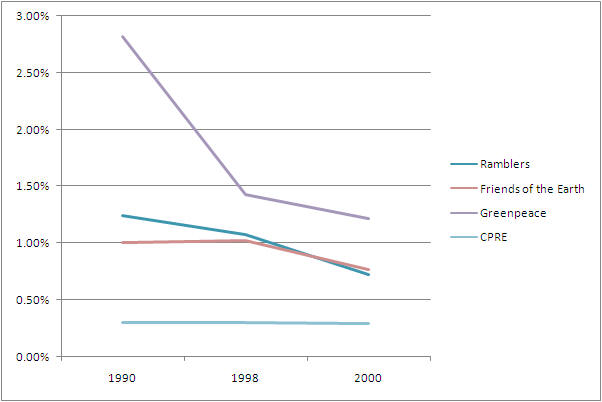
Figure 6: % of the British population claiming to belong to different environmental organisations 1990-2000 (source: British Social Attitudes Survey)
| Back to Page Top |
source: Citizen audit of Great Britain (2000-2001). Question asked: In the last 12 months, have you been a member of this type of organisation (in other words you have paid a membership fee if it is required), have you participated in an activity arranged by this type of organisation, have you donated money as an individual to this type of organisation, or have you done voluntary or unpaid work for this type of organisation? Environmental organisation (e.g. Greenpeace); Conservation organisation (e.g. The National Trust).
| Back to Page Top |
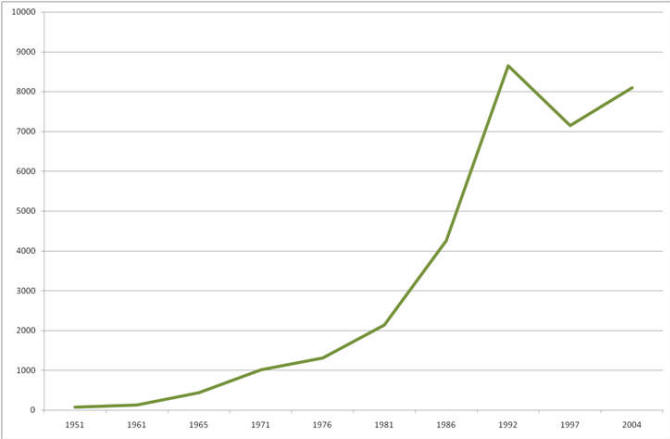
Figure 8: Combined membership of 17 US environmental organisations (in '000) (1951-2004).
Source: Bosso, C. J. Environment, Inc: From Grassroots to Beltway: Univ Pr of Kansas, 2005, and other sources. Details below.
| Back to Page Top |
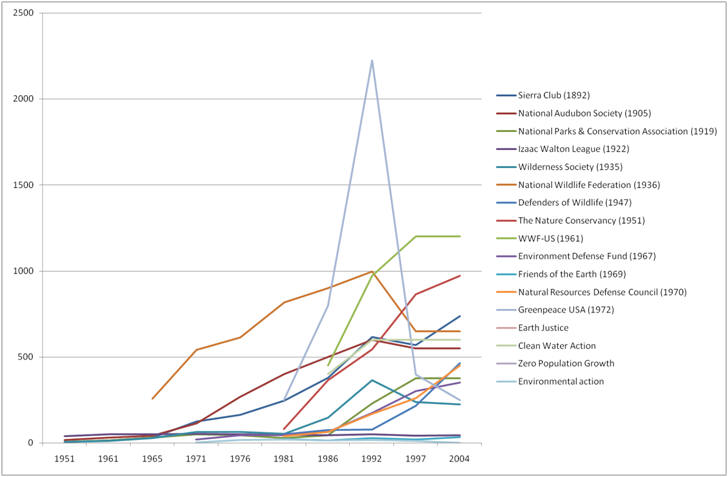
Figure 9: Membership of 17 US environmental organisations (in '000) (1951-2004).
Source: Bosso, C. J. Environment, Inc: From Grassroots to Beltway: Univ Pr of Kansas, 2005, and other sources. Total figure, above.
| Back to Page Top |
World
|
Nation |
1981
|
1990 |
1999 |
|
Netherlands |
11.4 |
23.8 |
45.1 |
|
USA |
5.1 |
8.3 |
15.9 |
|
Denmark |
5.4 |
12.5 |
13.2 |
|
Venezuela |
|
|
11.9 |
|
Sweden |
6.7 |
10.6 |
11.7 |
|
Greece |
|
|
11.0 |
|
Belgium |
3.1 |
6.6 |
10.5 |
|
Albania |
|
|
10.4 |
|
Uganda |
|
|
9.7 |
|
Luxembourg |
|
|
9.7 |
|
Austria |
|
2.9 |
9.6 |
|
Philippines |
|
|
8.2 |
|
Canada |
4.9 |
7.6 |
8.1 |
|
Vietnam |
|
|
7.6 |
|
India |
|
|
7.0 |
|
Czech Republic |
|
|
6.6 |
|
South Korea |
2.7 |
2.0 |
6.2 |
|
Finland |
0.7 |
5.4 |
4.8 |
|
Macedonia |
|
|
4.8 |
|
Mexico |
3.2 |
2.8 |
4.7 |
|
Moldova |
|
|
4.7 |
|
Iceland |
4.5 |
4.8 |
4.6 |
|
Algeria |
|
|
4.4 |
|
Montenegro |
|
|
4.4 |
|
Italy |
1.7 |
3.3 |
3.8 |
|
South Africa |
3.1 |
|
3.8 |
|
Slovenia |
|
1.7 |
3.3 |
|
Ireland |
2.7 |
2.3 |
3.2 |
|
Japan |
0.7 |
1.1 |
3.2 |
|
Chile |
|
1.6 |
3.1 |
|
Peru |
|
|
3.1 |
|
Croatia |
|
|
3.0 |
|
West Germany |
3.3 |
4.6 |
2.8 |
|
Slovakia |
|
|
2.6 |
|
Zimbabwe |
|
|
2.6 |
|
Argentina |
1.1 |
0.2 |
2.2 |
|
France |
1.5 |
2.3 |
2.1 |
|
Malta |
|
|
2.0 |
|
Spain |
2.4 |
1.4 |
1.9 |
|
Hungary |
|
1.4 |
1.9 |
|
Estonia |
|
2.7 |
1.7 |
|
UK |
4.7 |
5.9 |
1.5 |
|
Bulgaria |
|
3.8 |
1.5 |
|
Poland |
|
|
1.4 |
|
China |
|
1.0 |
1.2 |
|
Singapore |
|
|
1.1 |
|
Romania |
|
1.0 |
1.0 |
|
Belarus |
|
|
0.9 |
|
Portugal |
|
0.8 |
0.9 |
|
Lithuania |
|
2.1 |
0.8 |
|
Serbia |
|
|
0.8 |
|
Latvia |
|
4.3 |
0.7 |
|
Russia |
|
1.7 |
0.7 |
|
Ukraine |
|
|
0.6 |
|
Morocco |
|
|
0.6 |
|
Turkey |
|
|
0.2 |
Table 1. Environmental group membership over time in various countries
Source: World Values Surveys. The sampling error in the typical WVS survey is +3-5%, which should be considered in estimating the membership rates in any specific national survey.
(reproduced from Dalton, R. J. "The greening of the globe? Cross-national levels of environmental group membership." Environmental Politics 14, no. 4 (2005): 441-459) [note: the figures for some countries have been changed as they did not match the WVS figures]
| Back to Page Top |
![]()
| Back to Home | Back to Page Top |